
The Problem
Every sailing course I've taught or taken hits a wall around week 3. The instructor explains:
- Apparent wind: "The wind your boat feels is the combination of true wind and the wind created by your boat's motion."
- Optimal trim: "The mainsail should be at roughly 45 degrees to the centerline in most conditions."
- Heel: "As you turn downwind, the boat heels less because wind pressure decreases."
Students nod. Then someone asks: "But why does the sail collapse when I'm pointing this direction?" or "If I ease the main here, does it get better?"
And the instructor can't answer with a diagram anymore. You need to show them the boat sailing at that angle, in that wind, with that trim. Textbook drawings are static. Real sailing is dynamic.
The Insight
Abstract concepts become concrete only through immediate visual feedback.
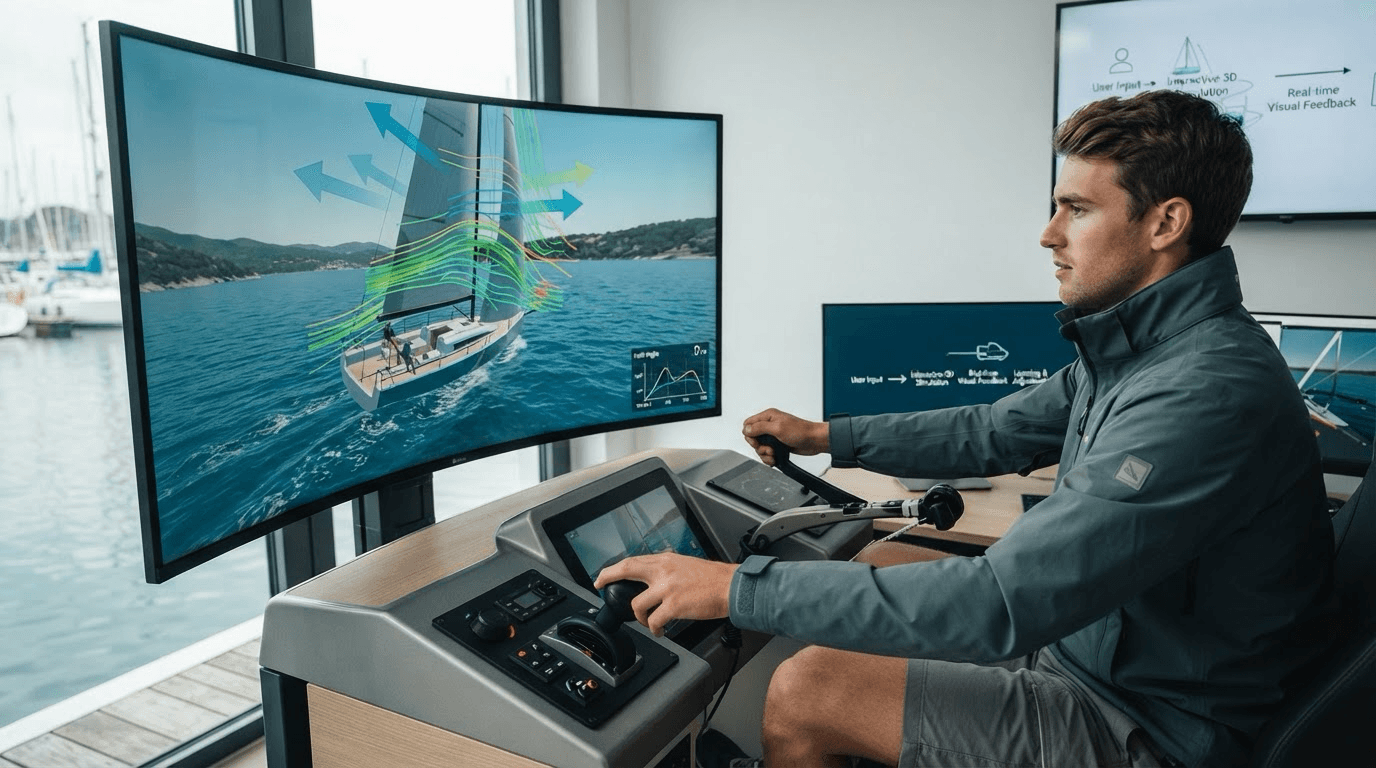
Text explanation of apparent wind is confusing. A 10-second animation of a boat sailing with vectors showing true wind, boat velocity, and apparent wind — suddenly it's obvious.
A diagram showing the "optimal 45° boom vang angle" means nothing. Watching the boat speed up and heel less when you move the slider to 45° and see the sail shape smooth out? That's intuitive. You see the cause. You see the effect. You're done.
The learning happens in the feedback loop, not the explanation.
The Solution
Built https://rumos-de-velejo.vercel.app/ — an interactive 3D sailing simulator where:
- You adjust the wind angle via slider (0° to 180°, true wind)
- The boat immediately responds: heels, speeds up/slows down, sails deform
- You see numbers update (speed, heel angle, optimal trim suggestion)
- The 3D view shows the exact sail position and boat orientation
No text explanation needed. The interaction is the explanation.
Bilingual (PT/EN). Runs in any browser. Single HTML file (~40 KB). Took a weekend to scaffold with Claude Code and Vibe coding; the real work was defining what to show and how to respond.
Three Design Choices
Accuracy vs. Clarity: Lookup table instead of CFD solver. Fast, consistent, and sailors understand it's simplified — they just want it reliably simplified.
Single File vs. SPA: No build, no bundler. Three.js from CDN. Deploy is copy-paste. Share is one URL. Constraints breed simplicity.
Bilingual from Day 1: Language as a dictionary object in code. Adding PT cost ~20 minutes. Planning early = trivial to extend.
What Didn't Work at First (and Why)
"Optimal Trim at 45°" Made No Sense
Problem: I put a slider for boom vang (retranca) trim and noted "45° is optimal for beam reach." Users moved the slider and had no idea why they should believe me.
Solution: Added real-time numerical feedback: "Trim optimal at 43°" + text showing what happens if you're off-trim (sail stalls, boat slows). Now you can see the consequence.
Insight: Interactivity without feedback is just a toy. The feedback loop is the teaching tool.
Sails Were Invisible
Problem: First version had uniform white sails. You couldn't see deformation, flutter, or shape changes. They looked like a 2D plane, not a 3D sail.
Solution: Added visual variety — color bands on the leech, batten pocket lines, foot in different colors. Now deformation is obvious.
Insight: Domain credibility requires visual detail. Sailors see sail shapes instantly. If the sail doesn't look right, the whole tool loses credibility.
Users Wanted to Rotate the View
Problem: Fixed camera locked to one angle. But sailors instinctively wanted to see the boat from different directions to understand heel and trim.
Solution: Drag-to-rotate, pinch-to-zoom. Now every user interaction pattern is supported.
Insight: Don't assume your viewing angle is the "right" one. Let users explore.
What Worked
✅ Feedback loops. Immediate cause-and-effect. Slider → boat heels → numbers update. Done.
✅ Visual credibility. Sailors recognize harbor buoys, port/starboard colors, correct terminology. Details build trust.
✅ Friction-free sharing. One URL, no signup, offline-capable. Shareable anywhere.
✅ Consistent physics. Sailors don't need CFD accuracy; they need reliable, fast feedback.
How This Happened
Developed with Claude Code + Vibe coding (AI-assisted rapid prototyping). The real work wasn't the code — it was design thinking:
- What concepts do sailors actually struggle with?
- What visual changes prove a concept?
- What feedback confirms understanding?
- How do you show the consequence of a choice?
The scaffolding was the easy part. The education design was hard.
Design Lessons (Not Technical)
Precision matters in domain tools. Sailors notice if you mislabel a term or get an angle wrong. A single mistake in terminology breaks credibility. You're not building a generic visualization; you're building for a community.
Visual credibility compounds. Each small detail (port red vs. starboard green, correct boom angles, harbor buoys in the right place) signals "this person knows sailing." Collectively, they make users trust the numbers and the feedback.
Show the consequence, not the rule. Don't say "optimal trim is 45°." Let users see that when they set it to 45°, the boat accelerates and the sail shape smooths. They infer the rule from the observation.
Interaction must be explorable. Users want to experiment: "What if I trim more aggressively?" "What happens if I bear away 10°?" Sliders and buttons must feel responsive. Latency kills understanding.
The Core Insight
Visualization + interaction > explanation + diagram.
Abstract concepts become intuitive instantly when users see them respond to their input in real time. Watching the boat heel and accelerate as you turn downwind teaches apparent wind better than any equation.
Five seconds of "cause and effect" outperforms a semester of "here's how it works."
User Testing Would Have Helped Earlier
I assumed sailors would understand the interface immediately. A few users in week 1 would have surfaced the "why should I set trim to 45°?" question. I only added the numerical feedback after I noticed users confused.
Lesson: Demo to 3 users before you think you're done. Patterns emerge fast.
What's Next
Short-term:
- Automated sequence ("Play" button) walking through all 6 points with narration
- Boat configurator (slider for length → adjusts polar curve)
Long-term:
- Regatta mode (race to waypoint with constraints)
- Real hydro physics (future project — requires learning CFD or panel methods properly)
For now: It's a finished, useful tool. Proof that focused education + interactivity beats half-finished ambition.
Why I'm Publishing This in Labs
Developed rapidly with AI assistance (Claude Code + Vibe). The technical implementation wasn't the learning — the learning was the problem definition.
Understanding that sailors struggle with abstract concepts. Realizing that feedback loops are the teaching mechanism. Discovering that visual credibility (colors, terminology, details) matters as much as accuracy.
These insights came from design thinking, not coding. So I'm documenting them here rather than as a full technical write-up.